


Oil and Natural Gas: Oil is down to $82.45 and EMA 200
- On Friday, the oil price rose to $84.52, forming a two-month high there.
- With the market’s opening this morning, we got a new low price of natural gas at $2.29.
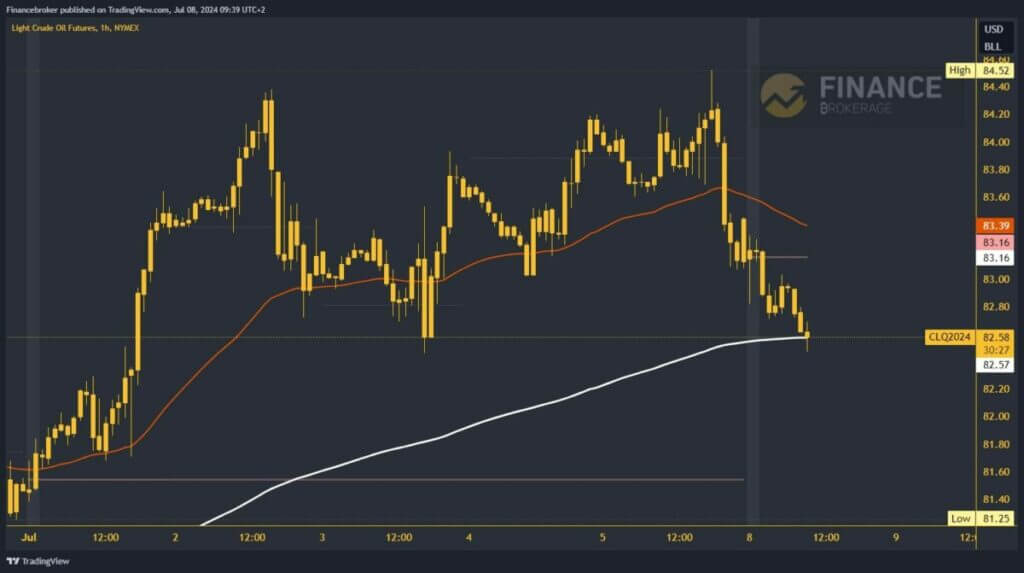
Oil chart analysis
On Friday, the oil price rose to $84.52, forming a two-month high there. After that, we saw the initiation of bearish consolidation, which brought us down to the $83.00 level by Friday’s market close. During this morning’s Asian trading session, the oil price continued to fall to the $82.46 level. Here, we meet and test the EMA 200 moving average support. If the current momentum continues, we will continue with further withdrawal.
Potential lower targets are the $82.20 and $82.00 levels. We need positive consolidation and support from the EMA 200 moving average for a bullish option. A return above $83.15 would bring us back to the positive side above the weekly open price. Potential higher targets are the $83.40 and $83.60 levels.
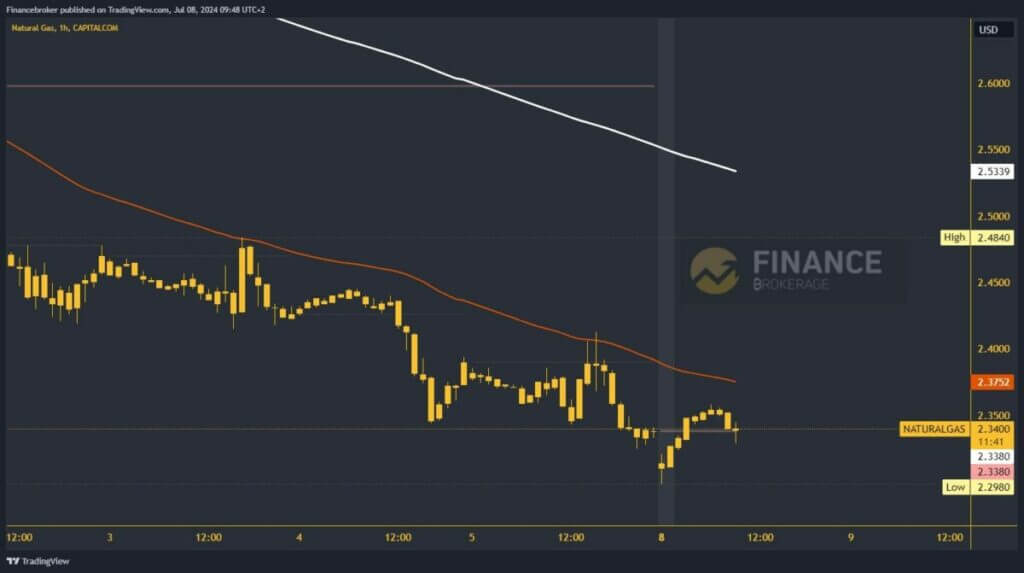
Natural gas chart analysis
With the market’s opening this morning, we got a new low price of natural gas at $2.29. After that, the price started a bullish consolidation from that level and recovered to $2.35. Also, we are now above the weekly open price, and this morning’s bearish gap from the market opening is closed. We need a continuation of positive consolidation and a move to the $2.37 level.
There, we encounter the EMA 50 moving average and need its support to continue on the bullish side. Potential higher targets are $2.40 and $2.45 levels. For a bearish option, we need a negative consolidation and a new pullback to this morning’s support at $2.30. The impulse below will create a new weekly low and thereby extend last week’s bearish trend. Potential lower targets are $2.25 and $2.20 levels.
The post Oil and Natural Gas: Oil is down to $82.45 and EMA 200 appeared first on FinanceBrokerage.