


S&P 500 rises to 5585.6, and Nasdaq to 20519.8 level
- The S&P 500 index is not slowing down, reaching a new all-time high of 5585.6.
- During this morning’s Asian session, the Nasdaq index rose to 20519.8, a new all-time high.
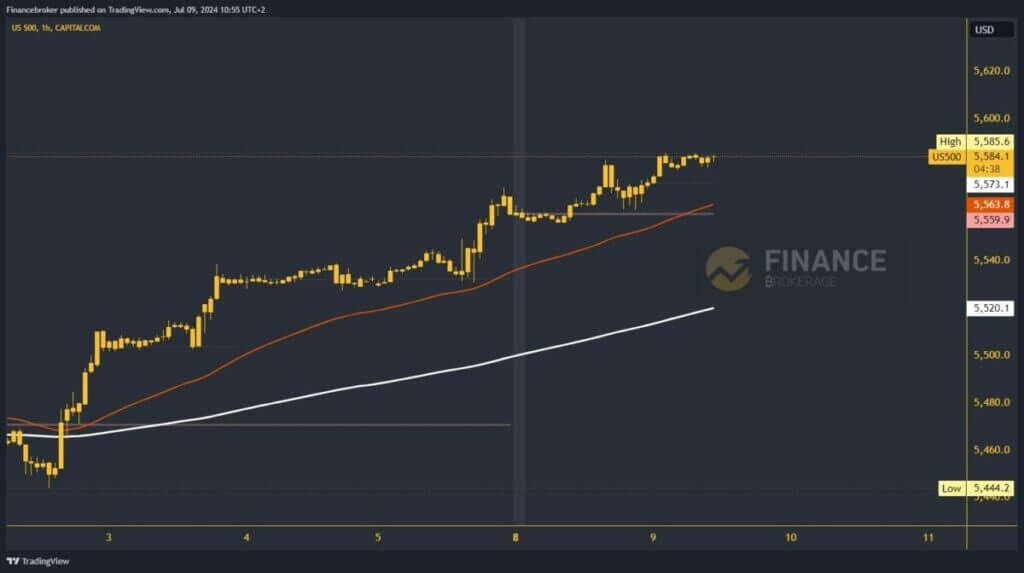
S&P 500 chart analysis
The S&P 500 index is not slowing down, reaching a new all-time high of 5585.6. On Monday morning, there was some pressure on the index, but it only lasted until the beginning of the US session. With a couple of bullish impulses, we were again on the bullish side. During this morning’s Asian trading session, the S&P 500 formed a new high and is currently still in that zone. Now, we need a new impulse to take us to a new all-time high.
Potential higher targets are the 5600.0 and 5620.0 levels. We need a downward impulse to the daily open price of 5573.1 for a bearish option. By going below, we could sense that we are slowly moving to the bearish side. If we continue a bit to 5560.0, we will test the weekly open price and the EMA 50 moving average. Potential lower targets are the 5540.0 and 5520.0 levels, where the EMA 200 moving average awaits us.
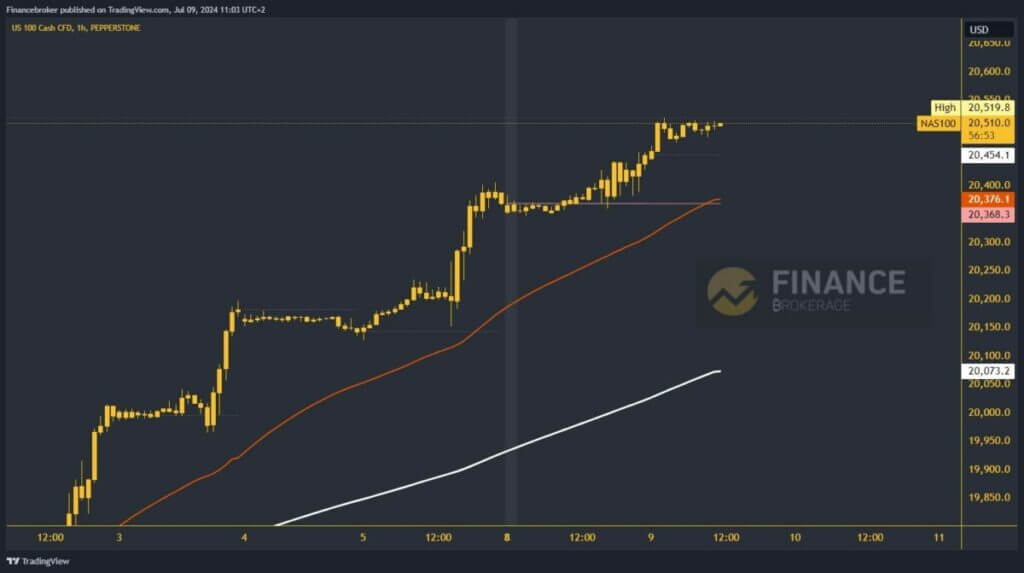
Nasdaq chart analysis
During this morning’s Asian session, the Nasdaq index rose to 20519.8, a new all-time high. After that, there was a decrease in momentum, but we are still high above the 20500.0 level. We can expect an increase in volatility in the next US session. The upward impulse leads to a new high and thus extends the bullish trend. Potential higher targets are 20550.0 and 20600.0 levels.
We need a negative consolidation and pullback to 20450.0, the daily open price for a bearish option. If we fail to hold there, a drop below to a new daily low will follow. This reinforces the bearish scenario, and Nasdaq will be forced to look for a new lower level of support. Potential lower targets are 20400.0 and 20300.0 levels. In the 20400.0 zone, we will have strong support in the EMA 50 moving average and the weekly open price.
The post S&P 500 rises to 5585.6, and Nasdaq to 20519.8 level appeared first on FinanceBrokerage.