


USDCAD and USDCNH: USDCNH under pressure at 7.28500 level
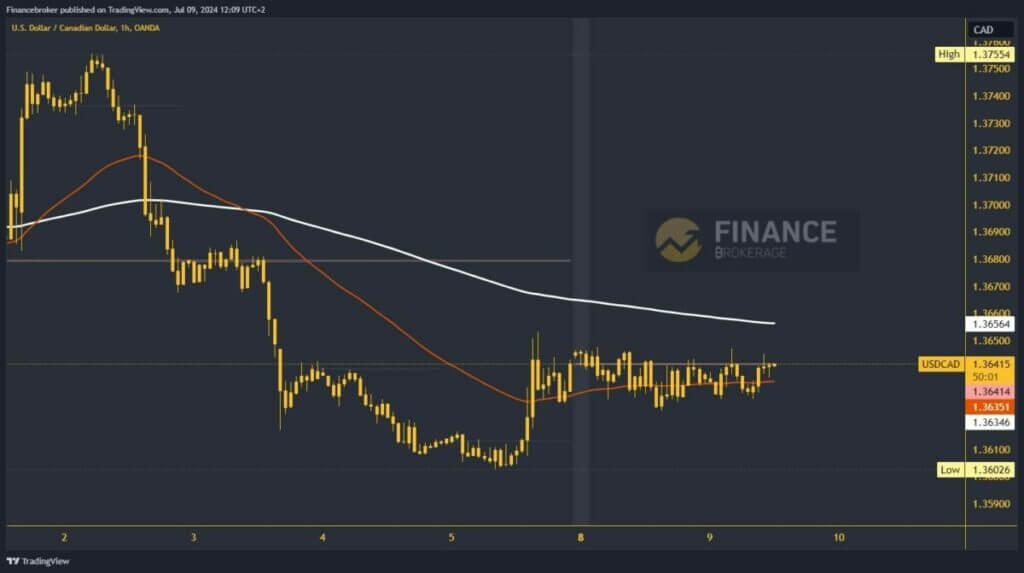
- During this morning’s Asian trading session, USDCAD moved in the 1.36300-1.36400 range.
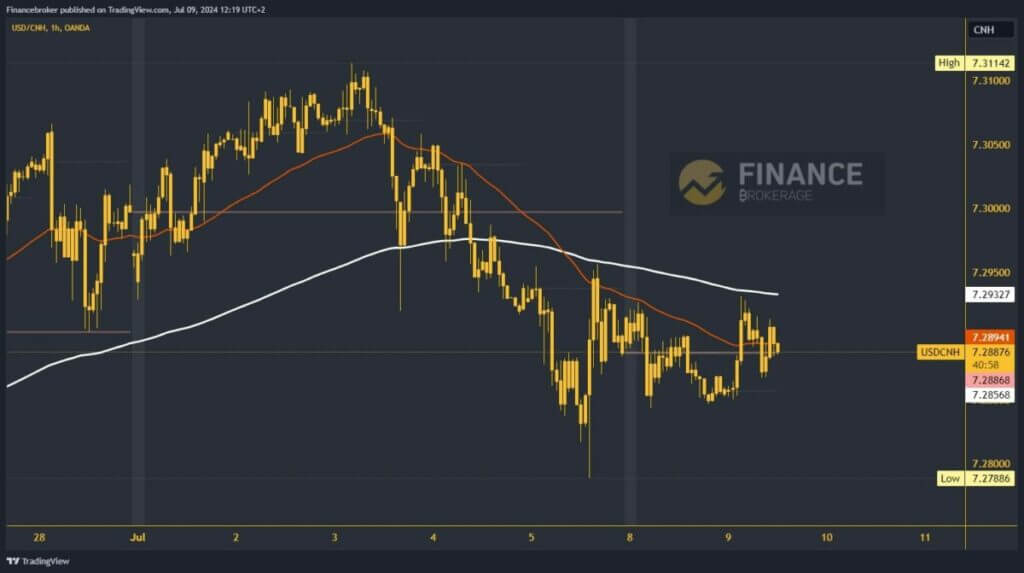
- Last Friday, USDCNH retreated to the 7.27886 level.
USDCAD chart analysis
During this morning’s Asian trading session, USDCAD moved in the 1.36300-1.36400 range. Yesterday’s movement was similar to today’s. We have support from the EMA 50 moving average and hope for a continuation to the bullish side. We need an impulse to the 1.36600 level. The pair encountered the EMA 200 moving project there, which could slow further progress to the bullish side.
Potential higher targets are 1.36700 and 1.36800 levels. For a bearish option, a descent to the 1.36300 level is needed. The impulse below takes us to a new daily low and thus increases the pressure on USDCAD. After that, the pair would have to go into retreat and look for a new support level. Potential lower targets are 1.36100 and 1.36000 levels. Going down to 1.36000, we will test last week’s low.
USDCNH chart analysis
Last Friday, USDCNH retreated to the 7.27886 level. After that, we saw a recovery to the EMA 200 moving average at 7.29500. This week’s movement is in the 7.28500-7.29300 range. On the upper side, the EMA 200 presents us with a problem for further recovery to the bullish side. With an impulse above 7.29500, we would be able to move to the positive side and gain the support of the moving average.
Potential higher targets are 7.30000 and 7.30500 levels. For a bearish option, we need a pullback of USDCNH to the 7.28500 support zone. This would put us at that level for the third time this week. This means that the pair is under pressure, and an impulse below to a new weekly low could easily occur. Potential lower targets are 7.28000 and 7.27500 levels.
The post USDCAD and USDCNH: USDCNH under pressure at 7.28500 level appeared first on FinanceBrokerage.